2D visualization
A 2D visualization produces a flat composite image of a product by stacking image layers, where each layer is shown or hidden depending on what the shopper has selected. This is useful for products where a real-time 3D scene would be too resource-intensive or unnecessary.
You manage 2D visualizations under Visualization › 2D Visualization in the backoffice.
How it fits together
A 2D visualization is a record that holds a name, an identifier, a status, and a link to one product. The actual display logic lives inside versions. Each version is an independently editable and publishable decision tree. Shoppers see only the active published version.
Versions are edited in a dedicated 2D Visualization Editor that runs in its own full-screen route, separate from the main backoffice layout.
A 2D visualization can also appear in the product editor under (Edit) in the Visualizations section, where you can add or navigate to an existing 2D visualization from the product side.
Create a 2D visualization
- Open Visualization › 2D Visualization and click Create.
- Fill in the form fields (see the table below).
- Click Save. The record is created and you are taken to the edit view.
- In the edit view, click Create Initial Version in the Versions section to create the first version of the decision tree.
- Click Edit next to the new version to open the editor.
General fields
| Field | What it does |
|---|---|
| Name | A clear and descriptive name used in the backoffice and in the product editor's Visualizations list. |
| Identifier | A machine-readable key used by the SDK to load the correct visualization. Must be unique across your team. |
| Status | Active or inactive. Inactive visualizations are not shown to shoppers. |
| Product (required) | The product this visualization belongs to. The editor's attribute palette is populated from the selected product's attributes. |
| Description | Optional freetext description for backoffice reference. |
Manage versions
A 2D visualization can have multiple versions. Only one version is published at a time. Unpublished versions are drafts you can freely edit. You manage versions from the edit screen's Versions section.
| Action | When to use it |
|---|---|
| Create New Version | Start a fresh draft, for example to redesign the decision tree without disturbing the live version. |
| Edit | Open the editor for an unpublished (draft) version. |
| Publish | Make a draft version live. The previously published version is replaced. |
| Duplicate | Copy a published version into a new draft so you can make incremental changes. |
| Preview | Open the editor in read-only mode to inspect a published version without editing it. |
| Delete | Permanently remove a draft version. Published versions cannot be deleted directly. |

To edit a version's identifier label, click the gear icon next to it. A sidebar opens with Version (a text identifier, for example 1.0.0) and Label (an optional human-readable label) fields.
A version may show an Out of sync badge if its decision tree references an attribute or step that no longer exists. Out-of-sync versions cannot be published until the conflicts are resolved.
2D Visualization Editor
Clicking Edit on a draft version opens the 2D Visualization Editor — a full-screen workspace with three panels.
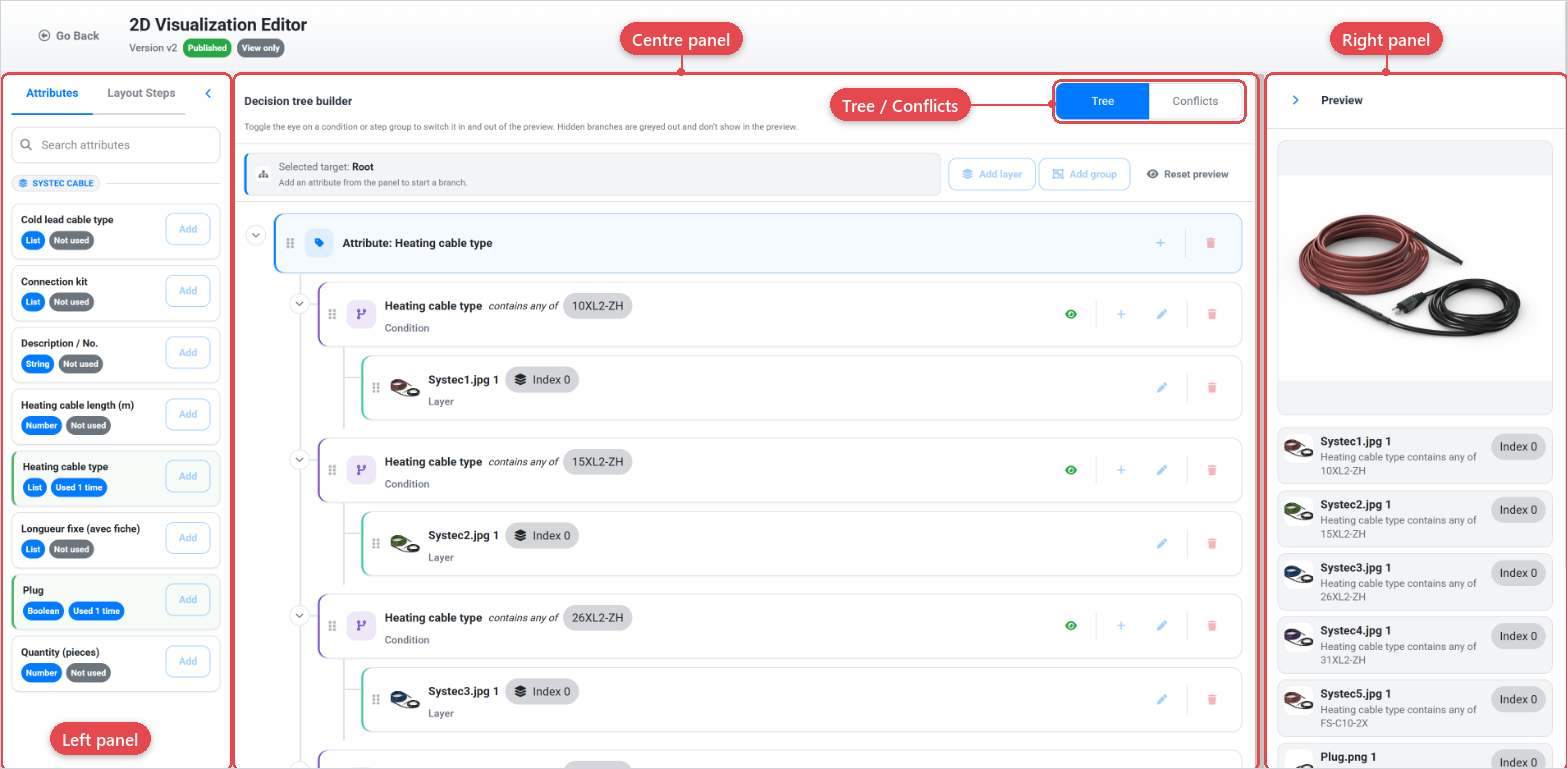
Left panel — attributes and steps palette
The left panel is the source of draggable building blocks for the decision tree. It has two tabs:
- Attributes: shows all attributes belonging to the linked product, grouped by category. Drag an attribute into the tree builder to add it as a condition node.
- Steps: shows the layout steps defined in the product's layout. Drag a step into the tree builder to scope a group of layers to that step.
Use the search bar at the top to filter attributes or steps by name.
Centre panel — decision tree builder
The centre panel is where you construct the logic of the visualization. The tree builder has two views, switched by a toggle in the header:
- Tree: the visual decision tree. Each node represents either a condition (attribute selection) or a step-group container. Inside each node you add image layer references that are shown when that branch's conditions are met.
- Conflicts: lists any inconsistencies in the tree, such as references to attributes or steps that have been removed from the product.
The topbar shows the version name and status (Draft or Published). From there you can Save draft to save the current tree state, or Publish to make the version live. The Go Back link returns you to the edit screen.
Work on one version at a time. Duplicate the current published version before making large structural changes so you can compare the two side by side.
Right panel — preview
The right panel shows a live composite preview of the image layers that are currently active in the tree. Use the step filter at the top to narrow the preview to a specific layout step. As you toggle conditions in the tree builder, the composite updates to reflect the active layers.
Link a 2D visualization from the product editor
You can also create or attach a 2D visualization from inside the product editor. In the product editor (Edit), scroll to the Visualizations section and click Add 2D. This navigates you to the 2D Visualization create form with the product pre-selected.
Existing 2D visualizations attached to the product appear in the same table alongside any 3D mapping entries. Click the edit icon to go back to the 2D visualization's edit screen.